On this page
A company can buy an AI subscription for every employee and still not know whether the software has become part of anyone's job. A survey question that asks whether a person has used AI at least a few times a year captures experimentation. A question about weekly use gets closer to recurring work. Daily use describes a narrower habit still.
That distinction is visible in Gallup's U.S. workplace series. In its July 20, 2026 report, Gallup said 52% of employees used AI in their role at least a few times a year in the second quarter of 2026, 30% used it frequently (a few times a week or more), and 15% used it daily. The figures are self-reports, not software usage logs. They also concern AI broadly, not only chatbots or one provider's paid product.
Those three frequency groups show how far occasional exposure is from routine use.
Four observations, three habits
Gallup reports a comparable set of second-quarter observations beginning in 2023. The table below uses the percentages published in its 2026 report and reproduces the frequency definitions used there.
| Quarter | Any use, a few times/year+ | Frequent, a few times/week+ | Daily |
|---|---|---|---|
| Q2 2023 | 21% | 11% | 4% |
| Q2 2024 | 27% | 12% | 4% |
| Q2 2025 | 40% | 19% | 8% |
| Q2 2026 | 52% | 30% | 15% |
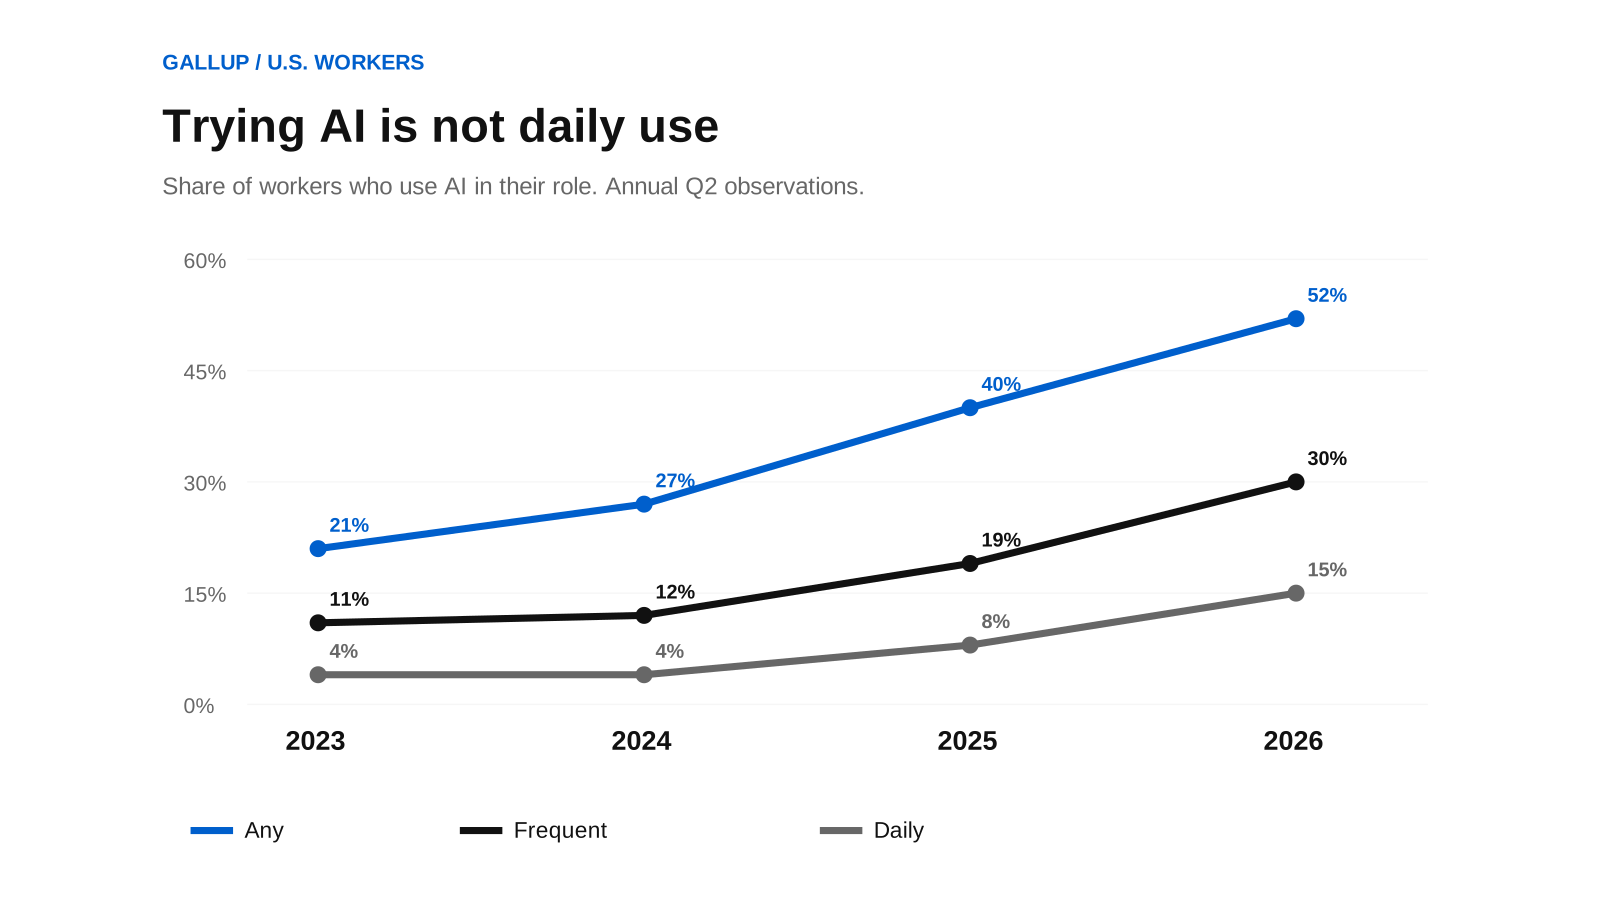
Figure: Gallup U.S. employee surveys showing any, frequent, and daily AI use by year; self-reported, not audited use..
Across these observations, the any-use share rose by 31 percentage points and the daily share by 11 points. They should not be described as increases of 31% and 11%: percentage points and relative growth are different measures. The frequent-use line, rising from 11% to 30%, is particularly useful because weekly repetition is evidence that AI has found a recurring place in some people's work.
Yet the breadth and depth of adoption remain different. In Q2 2026, 22 percentage points separated those using AI at least occasionally from those using it frequently, and another 15 points separated frequent users from daily users. Of the 52% who had any use, roughly 29% were daily users (15 divided by 52). That ratio is derived from the same survey categories, not from a separate survey of AI users. It does not say whether frequent users are productive, satisfied or using AI safely.
Occasional use is not the same as a recurring workflow, and daily use is not the only useful pattern. A weekly task can still depend on AI. A financial analyst may rely on AI every Friday; a support worker may need it in only one difficult case a week. Frequency describes use, not value.
What workers report about their organizations
Gallup also asks whether the respondent's organization has integrated AI tools to improve productivity, efficiency or quality. This is a perception measure about employer adoption, separate from the respondent's own frequency.
| Quarter | Employees saying their organization has adopted AI |
|---|---|
| Q3 2025 | 38% |
| Q4 2025 | 38% |
| Q1 2026 | 41% |
| Q2 2026 | 47% |
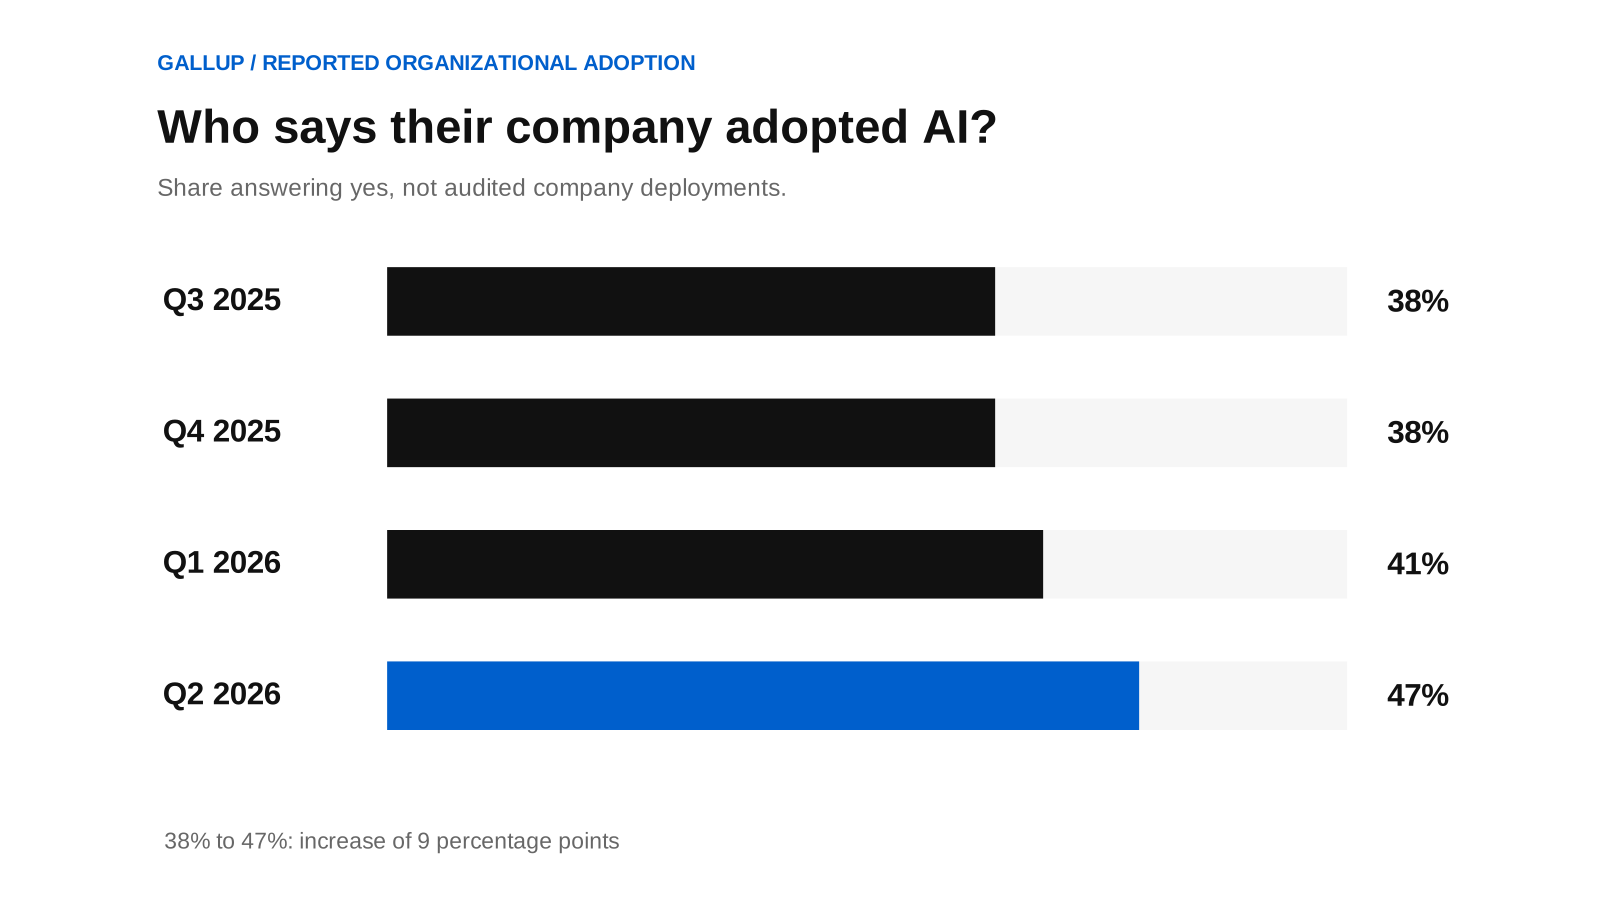
Figure: Gallup respondents reporting their organizations' AI adoption, not the share of independently counted companies..
The share rose nine percentage points between Q3 2025 and Q2 2026. In Q2 2026, another 20% said they did not know whether their organization had integrated AI. This is not an audited count of enterprises, licensed seats or actual deployments. It is the share of U.S. workers giving a particular answer about their employer. A large employer contributes many workers to a worker survey; it is not one equal-weighted company observation.
The uncertain fifth of respondents may reflect unclear internal communication, fragmented departmental rollout or simply the limits of what employees see. The survey does not identify which explanation applies. For operators, the uncertainty is a measurement problem: workplace adoption should be reported with the question, unit of analysis and time window beside the percentage.
Why adoption numbers differ across surveys
Microsoft and LinkedIn's 2024 Work Trend Index reported that 75% of surveyed knowledge workers globally used AI at work. It also reported that 78% of AI users brought their own AI tools to work. The research drew on 31,000 people in 31 countries and a population focused on knowledge work. Gallup's 52% concerns U.S. employees across roles in 2026. Different geography, jobs, sample design and question wording make a direct 75%-versus-52% trend invalid.
Pew Research Center provides another useful contrast. Its October 2025 analysis found that 21% of U.S. workers said at least some of their work was done with AI, up from 16% in a comparable 2024 survey. Pew was asking about the amount of work done with AI. Gallup asks how often AI is used in the role. A worker can use a chatbot every week while still describing only a small part of their work as AI-assisted. The published percentages measure different things, not competing estimates of one precisely defined behavior.
These differences matter when a slide deck stitches together the largest number available from each source. A figure without its denominator can look like acceleration even when the underlying questionnaire changed. A company should track its own workflows with stable definitions rather than borrow an external headline as an internal performance target.
From adoption frequency to continuity
The broad series suggests that AI trials have spread much faster than daily dependence. It does not establish how much time was saved, how reliable the answers were, or how often the work depended on private documents and conversations. Gallup's report describes common uses including writing, research and problem-solving; frequency alone cannot tell which of those tasks require durable context.
For a personal-context product, this distinction shapes the evaluation. If a worker uses two assistants and a coding tool every week, a useful question is how often they must re-explain the same project, reconnect a source or repair an out-of-date assumption. Other measures include corrections retained across sessions, permission errors caught before data is shared and the time required to change assistants. Those measures describe the next product-level question; Gallup's survey measures only use frequency.
Zortex's early-access description proposes a local-first world model across a person's existing apps, with per-AI access decisions. That design responds to a possible continuity problem. We should not infer from the Gallup series that a specific number of workers need Zortex, would pay for it or face that problem. The data establishes adoption frequency in the surveyed workforce. Product demand needs its own evidence.
The practical reading of the 2026 numbers is therefore narrower than “AI has taken over work.” A majority report trying it at least occasionally; fewer than a third report frequent use; a smaller group report daily use. Those three observations make a clearer starting point for deciding what to test next.
Data and figure notes
All percentages in the two figures come from Gallup's July 2026 table; no interpolation is used for missing quarters. The figures and geometric cover can be regenerated with the source script. Microsoft and Pew figures are shown as methodologically separate comparisons, not plotted into Gallup's series.